

Visualization
Axes, plots, charts, vector fields and live readouts.
Axes
Linear, log, symlog, power, category and time axes, tick steps, number formats, styles, titles and crossings.
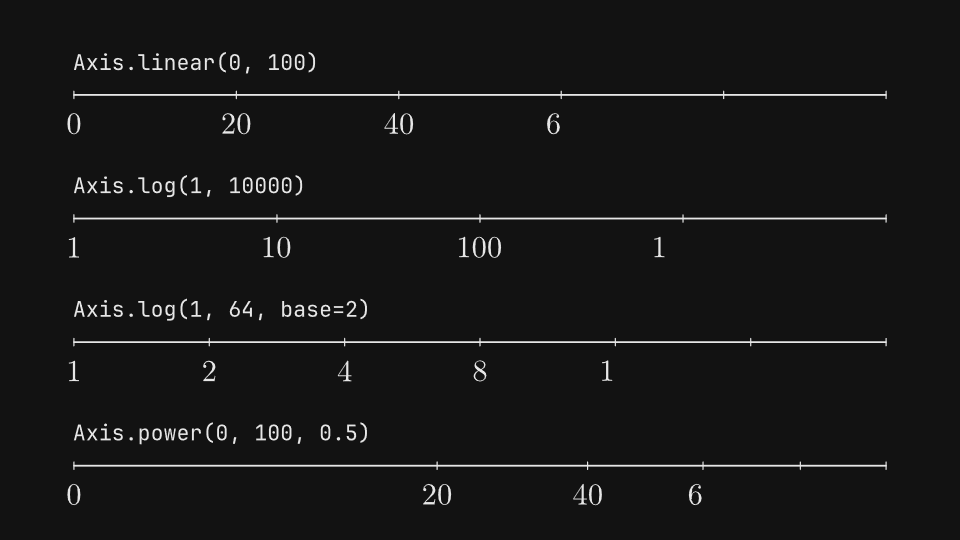
gaanim examples/visualization/axes.pyCode · 190 lines
"""Axes: scales, tick steps, number formats, styles, titles and crossings.

``Axis`` describes one axis and is immutable: every method returns a copy.
Each row draws a number line from the axis its label builds; the last
segments put pairs of axes on planes for their titles and crossings.
"""

import math
import os

from gaanim import Axis, Scene, Zones

DRAW = 1.0
HOLD = 0.8
# Number lines and planes are drawn larger than their default size, so their
# numbers read as easily as the labels.
ZOOM = 1.6
PLANE_ZOOM = 1.3

scene = Scene()
accent = scene.canvas.color("accent")


def table(rows):
    """Draw one number line per (label, axis) row across the frame, its label above it."""
    grid = scene.layout.zones(Zones.rows(len(rows), gap="24px", padding="page_padding"))
    lines = []
    for zone, (label, axis) in zip(grid, rows):
        top, body = zone.split(Zones.rows(["2fr", "3fr"]))
        length = zone.width * 0.9
        # The label starts where the line does.
        start = top.inset((0, (zone.width - length) / 2))
        scene.text(label, role="code").place(start, anchor="bottom_left")
        line = scene.viz.number_line(axis, length=length / ZOOM)
        # A number line's origin is the middle of the axis, above its numbers.
        x, y = body.center
        line.drawable().scale_to(ZOOM).move_to(x, y + 0.2)
        lines.append(line)
    scene.play([line.animate.create() for line in lines], duration=DRAW)
    scene.wait(HOLD)


def planes(cells, size=(0.8, 0.75), **options):
    """Draw a plane per (label, x, y) cell of a 2 x 2 grid, its label above it.

    ``size`` is the share of the cell's width and height the plot area takes.
    """
    grid = scene.layout.zones(
        Zones.grid(rows=2, columns=2, column_gap="96px", row_gap="48px", padding="page_padding")
    )
    spaces = []
    for zone, (label, x, y) in zip(grid, cells):
        top, body = zone.split(Zones.rows(["1fr", "4fr"]))
        scene.text(label, role="code").place(top, anchor="bottom")
        width, height = body.width * size[0] / PLANE_ZOOM, body.height * size[1] / PLANE_ZOOM
        plane = scene.viz.cartesian_2d(x, y, width=width, height=height, **options)
        # A plane's origin is the middle of its plot area; leave its numbers
        # and titles room below it.
        x, y = body.center
        plane.scale_to(PLANE_ZOOM).move_to(x, y + body.height * (1 - size[1]) / 6)
        spaces.append(plane)
    scene.play([plane.animate.create() for plane in spaces], duration=DRAW)
    scene.wait(HOLD)


# A scale maps data to position: logarithmic scales space orders of
# magnitude evenly and a power scale stretches values by an exponent.
scene.segment("scales")
table([
    ("Axis.linear(0, 100)", Axis.linear(0, 100)),
    ("Axis.log(1, 10000)", Axis.log(1, 10000)),
    ("Axis.log(1, 64, base=2)", Axis.log(1, 64, base=2)),
    ("Axis.power(0, 100, 0.5)", Axis.power(0, 100, 0.5)),
])

# symlog is logarithmic on both sides of zero and linear within
# ``threshold`` of it; category places named groups; time takes seconds.
scene.segment("more_scales")
table([
    ("Axis.symlog(-10, 10)", Axis.symlog(-10, 10)),
    ("Axis.symlog(-100, 100, threshold=10)", Axis.symlog(-100, 100, threshold=10)),
    ('Axis.category(["low", "mid", "high"])', Axis.category(["low", "mid", "high"])),
    ("Axis.time(0, 3600).ticks(900)", Axis.time(0, 3600).ticks(900)),
])

# Without ticks() the step is chosen for the domain; ticks(step) fixes it
# and auto_ticks() goes back to the chosen one.
scene.segment("ticks")
table([
    ("Axis.linear(0, 10)", Axis.linear(0, 10)),
    ("Axis.linear(0, 0.05)", Axis.linear(0, 0.05)),
    ("Axis.linear(0, 10).ticks(5)", Axis.linear(0, 10).ticks(5)),
    ("Axis.linear(0, 10).ticks(5).auto_ticks()", Axis.linear(0, 10).ticks(5).auto_ticks()),
])

# minor_ticks(n) splits each step into n parts with shorter, unnumbered ticks.
scene.segment("minor_ticks")
table([
    ("Axis.linear(0, 10).ticks(2).minor_ticks(2)", Axis.linear(0, 10).ticks(2).minor_ticks(2)),
    ("Axis.linear(0, 10).ticks(2).minor_ticks(4)", Axis.linear(0, 10).ticks(2).minor_ticks(4)),
    ("Axis.linear(0, 10).ticks(5).minor_ticks(5)", Axis.linear(0, 10).ticks(5).minor_ticks(5)),
])

# numbers() formats the tick text; negative numbers use a typographic minus.
scene.segment("numbers")
axis = Axis.linear(-1, 1).ticks(0.5)
table([
    ("axis = Axis.linear(-1, 1).ticks(0.5)", axis),
    ('axis.numbers("fixed", precision=2)', axis.numbers("fixed", precision=2)),
    ('axis.numbers("percent", precision=0)', axis.numbers("percent", precision=0)),
    ('axis.numbers("scientific", precision=1)', axis.numbers("scientific", precision=1)),
])

# fraction and pi round each value to the nearest multiple of
# 1/denominator and reduce it.
scene.segment("fractions")
angle = Axis.linear(0, math.tau).ticks(math.tau / 4)
table([
    ('axis.numbers("fraction", denominator=2)', axis.numbers("fraction", denominator=2)),
    (
        'Axis.linear(0, 2).ticks(0.25).numbers("fraction", denominator=4)',
        Axis.linear(0, 2).ticks(0.25).numbers("fraction", denominator=4),
    ),
    ("angle = Axis.linear(0, tau).ticks(tau / 4)", angle),
    ('angle.numbers("pi", denominator=2)', angle.numbers("pi", denominator=2)),
])

# style() replaces only the properties it names and keeps the theme's for
# the rest.
scene.segment("style")
axis = Axis.linear(0, 4).ticks(1)
table([
    ("axis = Axis.linear(0, 4).ticks(1)", axis),
    ("axis.style(color=accent)", axis.style(color=accent)),
    ("axis.style(width=0.05)", axis.style(width=0.05)),
    ("axis.style(number_color=accent)", axis.style(number_color=accent)),
])

scene.segment("tick_style")
table([
    ("axis.style(tick_length=0.3)", axis.style(tick_length=0.3)),
    ("axis.style(tick_width=0.05)", axis.style(tick_width=0.05)),
    ('axis.label("t").style(label_color=accent)', axis.label("t").style(label_color=accent)),
])

# label() titles an axis past its positive end, past its negative end
# ("start") or along its middle ("center", the y title turned).
scene.segment("titles")
X = Axis.linear(0, 4).ticks(1)
Y = Axis.linear(0, 3).ticks(1)
planes(
    [
        ('X.label("x"), Y.label("y")', X.label("x"), Y.label("y")),
        ('X.label("x", position="start")', X.label("x", position="start"), Y),
        (
            'X.label("time", position="center")\nY.label("speed", position="center")',
            X.label("time", position="center"),
            Y.label("speed", position="center"),
        ),
        (
            "X.style(tick_color=accent)\nY.style(tick_color=accent)",
            X.style(tick_color=accent),
            Y.style(tick_color=accent),
        ),
    ],
    size=(0.6, 0.45),
)

# crossing() is the value of this axis where the other axis crosses it:
# "auto" (zero when in range), "zero", "min", "max" or a data value. The
# numbers are off here, so the grid shows where each axis runs.
scene.segment("crossings")
X = Axis.linear(-1, 4).ticks(1)
Y = Axis.linear(-1, 3).ticks(1)
planes(
    [
        ('X.crossing("zero")\nY.crossing("zero")', X.crossing("zero"), Y.crossing("zero")),
        ('X.crossing("min")\nY.crossing("min")', X.crossing("min"), Y.crossing("min")),
        ('X.crossing("max")\nY.crossing("max")', X.crossing("max"), Y.crossing("max")),
        ("X.crossing(3)\nY.crossing(2)", X.crossing(3), Y.crossing(2)),
    ],
    numbers=False,
)

if snapshots := os.environ.get("GAANIM_SNAPSHOTS"):
    # The first number lines drawing, then every segment once drawn.
    scene.snapshots(snapshots, [0.5] + [(DRAW + HOLD) * index + 1.6 for index in range(10)])
else:
    scene.render()
Coordinate spaces
Cartesian, polar and complex planes, number lines, grids and numbers, coordinates that place objects and animated views.
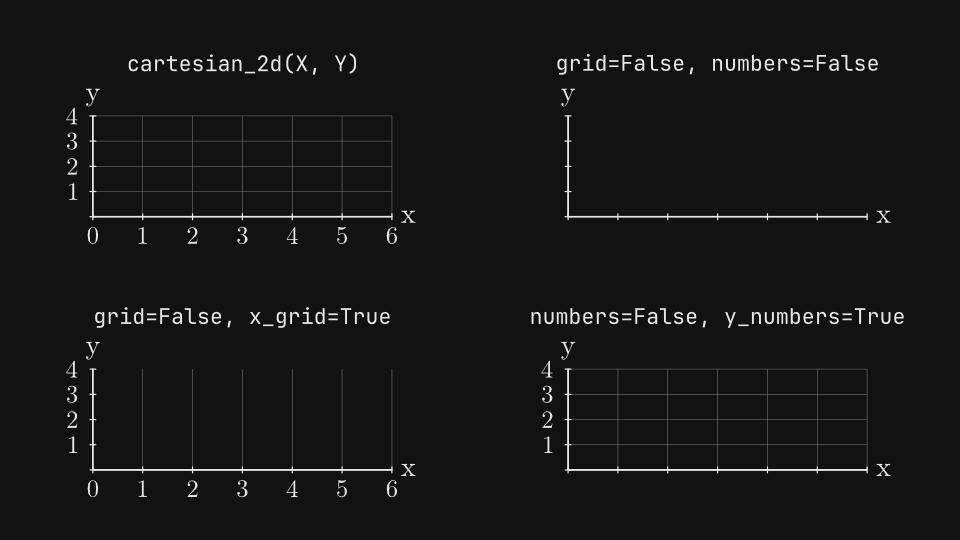
gaanim examples/visualization/coordinate_spaces.pyCode · 245 lines
"""Coordinate spaces: Cartesian, polar and complex planes, number lines, layers, coordinates and views.

A coordinate space draws axes, grids, ticks, numbers and titles as separate
layers and maps data to the frame. The first segments switch layers on and
off and bring them in one by one; the next ones place objects at data
coordinates and change the view window, then come number lines, polar
spaces and the complex plane.
"""

import math
import os

from gaanim import Anchor, Axis, Scene, Zones, computed

DRAW = 1.0
HOLD = 0.8
MOVE = 1.4
# Planes are drawn larger than their default size so their numbers read
# as easily as the labels.
ZOOM = 1.3

scene = Scene()
accent = scene.canvas.color("accent")
rule = scene.canvas.color("rule")
X = Axis.linear(0, 6).ticks(1).label("x")
Y = Axis.linear(0, 4).ticks(1).label("y")


def cells(count, columns=2, bands=("1fr", "4fr")):
    """A padded grid of ``count`` cells, each split into a label band and a body."""
    rows = -(-count // columns)
    grid = scene.layout.zones(
        Zones.grid(rows=rows, columns=columns, column_gap="96px", row_gap="48px", padding="page_padding")
    )
    return [zone.split(Zones.rows(list(bands))) for zone in list(grid)[:count]]


def plane_in(body, x=X, y=Y, size=(0.7, 0.55), **options):
    """A Cartesian plane whose plot area takes ``size`` of ``body``, centered in it."""
    width, height = body.width * size[0] / ZOOM, body.height * size[1] / ZOOM
    plane = scene.viz.cartesian_2d(x, y, width=width, height=height, **options)
    # A plane's origin is the middle of its plot area.
    return plane.scale_to(ZOOM).move_to(*body.center)


def gallery(variants):
    """Draw a plane per (label, options) cell of a 2 x 2 grid, its label above it."""
    planes = []
    for (top, body), (label, options) in zip(cells(len(variants)), variants):
        scene.text(label, role="code").place(top, anchor="bottom")
        planes.append(plane_in(body, **options))
    scene.play([plane.animate.create() for plane in planes], duration=DRAW)
    scene.wait(HOLD)


# Global switches (grid, axes, ticks, numbers, labels) turn a kind of layer
# off on both axes; x_* and y_* switches override them for one axis.
scene.segment("visibility")
gallery([
    ("cartesian_2d(X, Y)", {}),
    ("grid=False, numbers=False", {"grid": False, "numbers": False}),
    ("grid=False, x_grid=True", {"grid": False, "x_grid": True}),
    ("numbers=False, y_numbers=True", {"numbers": False, "y_numbers": True}),
])

scene.segment("more_visibility")
gallery([
    ("labels=False", {"labels": False}),
    ("axes=False, ticks=False", {"axes": False, "ticks": False}),
    ("ticks=False, y_ticks=True", {"ticks": False, "y_ticks": True}),
    ("x_axis=False, x_numbers=False", {"x_axis": False, "x_numbers": False}),
])

# Every layer is a drawable of its own: bring each one in with its own
# animation, or style it apart from the rest.
scene.segment("layers")
grid = scene.layout.zones(Zones.columns(["5fr", "9fr"], gap="72px", padding="page_padding"))
names = ["minor_grid", "major_grid", "axes", "ticks", "numbers", "labels"]
rows = grid[0].split(Zones.rows(len(names) + 1))
plane = plane_in(
    grid[1],
    x=Axis.linear(0, 6).ticks(1).minor_ticks(2).label("x"),
    y=Axis.linear(0, 4).ticks(1).minor_ticks(2).label("y"),
    size=(0.8, 0.7),
)
for row, name in zip(rows, names):
    label = scene.text(f'plane.layer("{name}")', role="code").place(row, anchor="left").hidden()
    layer = plane.layer(name)
    entrance = layer.animate.fade_in() if name in ("numbers", "labels") else layer.animate.create()
    scene.play([entrance, label.animate.fade_in()], duration=0.5)
styled = scene.text('plane.layer("major_grid")\n    .opacity(0.3)', role="code").place(rows[-1], anchor="left").hidden()
scene.play([plane.layer("major_grid").animate.opacity(0.3), styled.animate.fade_in()], duration=0.5)
scene.wait(HOLD)

# coord(x, y) is a data point owned by the space: at_coordinate() makes an
# object its child and coord().place() puts one there. data_to_scene() is a
# frame point that follows the data for objects outside the space, such as
# connectors and labels. All of them follow the plane when it turns.
scene.segment("coordinates")
left, right = scene.layout.zones(Zones.columns(["8fr", "6fr"], gap="72px", padding="page_padding"))
plane = plane_in(left, x=Axis.linear(-4, 4).ticks(1), y=Axis.linear(-3, 3).ticks(1), size=(0.8, 0.75))
dot = scene.geometry.dot(0.14).at_coordinate(plane.coord(2, 2))
square = plane.coord(-2, 1).place(scene.geometry.square(0.3))
ring = scene.geometry.circle(0.2).no_fill().stroke(accent, 0.05).follow(plane.data_to_scene(2, -2))
notes = []
for row, (label, target) in zip(
    right.split(Zones.rows(3)),
    [
        ("dot.at_coordinate(\n    plane.coord(2, 2))", dot),
        ("plane.coord(-2, 1)\n    .place(square)", square),
        ("ring.follow(\n    plane.data_to_scene(2, -2))", plane.data_to_scene(2, -2)),
    ],
):
    note = scene.text(label, role="code").place(row, anchor="left")
    notes.append((note, scene.geometry.connector(note.anchor_point(Anchor.LEFT), target)))
scene.play(
    [plane.animate.create()] + [part.animate.fade_in() for part in (dot, square, ring)],
    duration=DRAW,
)
scene.play([anim for note, link in notes for anim in (note.animate.fade_in(), link.animate.grow_arrow())], duration=0.6)
scene.play([plane.animate.rotate_to(0.25)], duration=MOVE)
scene.play([plane.animate.rotate_to(0)], duration=MOVE)
scene.wait(HOLD)

# view_to() changes the data window while the plot area stays put. Axes
# with automatic ticks regenerate their step for the new window; a fixed
# ticks(step) is kept.
scene.segment("view")
panels = cells(2, bands=("1fr", "5fr"))
views = []
for (top, body), (label, x) in zip(
    panels,
    [("Axis.linear(-6, 6)", Axis.linear(-6, 6)), ("Axis.linear(-6, 6).ticks(2)", Axis.linear(-6, 6).ticks(2))],
):
    scene.text(label, role="code").place(top, anchor="bottom")
    space = plane_in(body, x=x, y=Axis.linear(-3, 3), size=(0.8, 0.55))
    wave = space.plot(lambda value: 2 * math.sin(value)).stroke(accent, 0.04)
    views.append((space, wave))
caption = scene.layout.zones(Zones.rows(["5fr", "1fr"], padding="page_padding"))[1]
scene.play([part.animate.create() for space, wave in views for part in (space, wave)], duration=DRAW)
shown = None
for window in [(-1.5, 1.5), (-10, 10), (-6, 6)]:
    text = scene.text(f"plane.animate.view_to({window}, (-3, 3))", role="code").place(caption).hidden()
    swap = [text.animate.fade_in()] + ([shown.animate.fade_out()] if shown else [])
    scene.play(swap + [space.animate.view_to(window, (-3, 3)) for space, _ in views], duration=MOVE)
    shown = text
scene.wait(HOLD)

# A number line is a one-dimensional space: point_ref() follows a value,
# function() draws a curve across it and reveal= draws it up to a value.
scene.segment("number_line")
rows = scene.layout.zones(Zones.rows(["1fr", "3fr", "1fr", "2fr"], padding="page_padding"))
theta = scene.viz.parameter(0.0)
line = scene.viz.number_line(
    Axis.linear(0, 3 * math.pi).ticks(math.pi / 2).numbers("pi", denominator=2),
    length=rows[1].width * 0.9 / ZOOM,
)
line.drawable().scale_to(ZOOM).move_to(*rows[1].center)
curve = line.function(math.sin, normal_scale=1.0, reveal=theta).stroke(accent, 0.05)
point = scene.geometry.dot(0.12).follow(
    line.point_ref(theta, normal_offset=computed(lambda t: math.sin(t), inputs=[theta]))
)
start = rows[0].inset((0, rows[0].width * 0.05))
scene.text("line.function(math.sin, reveal=theta)", role="code").place(start, anchor="bottom_left")
# Number lines take axis_visible, ticks, numbers and labels switches; the
# dot on this one follows a point_ref of a value computed from theta.
bare = scene.viz.number_line(Axis.linear(0, 10).ticks(1), length=rows[3].width * 0.9 / ZOOM, numbers=False)
bare.drawable().scale_to(ZOOM).move_to(*rows[3].center)
start = rows[2].inset((0, rows[2].width * 0.05))
scene.text("number_line(Axis.linear(0, 10).ticks(1), numbers=False)", role="code").place(start, anchor="bottom_left")
marker = scene.geometry.dot(0.12).follow(bare.point_ref(computed(lambda t: 10 * t / (3 * math.pi), inputs=[theta])))
scene.play(
    [line.animate.create(), bare.animate.create(), curve.animate.fade_in(), point.animate.fade_in(), marker.animate.fade_in()],
    duration=DRAW,
)
scene.play([theta.animate.set(3 * math.pi)], duration=3.0)
scene.wait(HOLD)

# A polar space has rings and spokes, which rings= and spokes= switch apart
# from grid=; angle_divisions sets the number of spokes.
radial = Axis.linear(0, 3).ticks(1).label("r")


def polar_in(body, axis=radial, **options):
    """A polar space as large as ``body`` allows, its grid stroked with the theme's rule color."""
    radius = min(body.width, body.height) * 0.42 / ZOOM
    polar = scene.viz.polar(axis, radius=radius, **options)
    polar.layer("grid").stroke(rule, 0.015)
    polar.drawable().scale_to(ZOOM).move_to(*body.center)
    return polar


for name, variants in [
    ("polar", [("polar(radial)", {}), ("polar(radial, angle_divisions=6)", {"angle_divisions": 6})]),
    ("polar_grid", [("polar(radial, rings=False)", {"rings": False}), ("polar(radial, spokes=False)", {"spokes": False})]),
]:
    scene.segment(name)
    polars = []
    for (top, body), (label, options) in zip(cells(2, bands=("1fr", "6fr")), variants):
        scene.text(label, role="code").place(top, anchor="bottom")
        polars.append(polar_in(body, **options))
    scene.play([polar.animate.create() for polar in polars], duration=DRAW)
    scene.wait(HOLD)

# plot() draws r = f(angle) over one turn, or over a domain of angles.
scene.segment("polar_plot")
curves = []
for (top, body), (label, function, domain) in zip(
    cells(2, bands=("1fr", "6fr")),
    [
        ("polar.plot(lambda a:\n    2 * abs(cos(3 * a)))", lambda a: 2 * abs(math.cos(3 * a)), (0, math.tau)),
        ("polar.plot(lambda a: a / 6,\n           (0, 12))", lambda a: a / 6, (0, 12)),
    ],
):
    scene.text(label, role="code").place(top, anchor="bottom")
    polar = polar_in(body, axis=Axis.linear(0, 2).ticks(0.5).label("r"))
    curves.append((polar, polar.plot(function, domain).stroke(accent, 0.05)))
scene.play([polar.animate.create() for polar, _ in curves], duration=DRAW)
scene.play([curve.animate.create() for _, curve in curves], duration=1.6)
scene.wait(HOLD)

# The complex plane is a Cartesian space titled Re and Im whose coordinates
# are the real and imaginary parts; here, the cube roots of 8i. Without
# axes it spans -5 to 5 and -3 to 3.
scene.segment("complex")
top, body = cells(1, columns=1, bands=("1fr", "9fr"))[0]
scene.text("scene.viz.complex()", role="code").place(top, anchor="bottom")
plane = scene.viz.complex(width=body.width * 0.75 / ZOOM, height=body.height * 0.75 / ZOOM)
plane.scale_to(ZOOM).move_to(*body.center)
roots = []
for k in range(3):
    angle = math.pi / 6 + k * math.tau / 3
    z = (2 * math.cos(angle), 2 * math.sin(angle))
    roots.append(scene.geometry.dot(0.14).at_coordinate(plane.coord(*z)))
    sign = "+" if z[1] >= 0 else "-"
    value = scene.text(f"{round(z[0], 2) + 0:.2f} {sign} {abs(z[1]):.2f}i", role="code")
    roots.append(plane.coord(z[0] + (1.7 if z[0] > -0.01 else -1.7), z[1]).place(value))
scene.play([plane.animate.create()] + [root.animate.fade_in() for root in roots], duration=DRAW)
scene.wait(HOLD)

if snapshots := os.environ.get("GAANIM_SNAPSHOTS"):
    scene.snapshots(snapshots, [1.6, 3.4, 5.6, 7.7, 9.4, 10.9, 15.5, 16.9, 18.2, 21.6, 23.8, 25.6, 27.4, 29.3, 30.8, 32.6])
else:
    scene.render()
Plots
Function, parametric and implicit curves, log axes, Riemann sums and other calculus constructions, and curves that follow parameters.
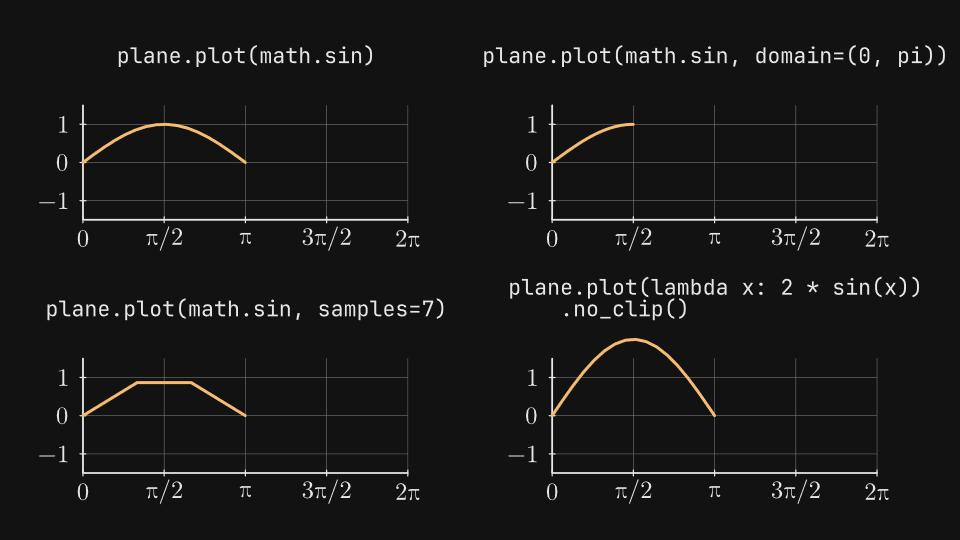
gaanim examples/visualization/plots.pyCode · 265 lines
"""Plots: functions, parametric and implicit curves, contours, calculus constructions and reactive curves.

Every curve lives in the data coordinates of the plane that draws it. The
first segments draw curves of each kind, the next ones the calculus
constructions (tangents, normals, secants, projections, areas and Riemann
sums) and the last one curves that follow a parameter or the time. Each
curve is stroked with the theme's accent.
"""

import math
import os

from gaanim import Axis, Scene, Zones

DRAW = 1.2
HOLD = 0.8
# Each gallery draws its planes, then their marks, and holds.
STEP = 2 * DRAW + HOLD
# Planes are drawn larger than their default size so their numbers read
# as easily as the labels.
ZOOM = 1.3

scene = Scene()
accent = scene.canvas.color("accent")
foreground = scene.canvas.color("foreground")
# crossing("min") keeps both axes on the edges of the plot, clear of the curves.
ANGLE = Axis.linear(0, 2 * math.pi).ticks(math.pi / 2).numbers("pi", denominator=2)
WAVE = Axis.linear(-1.5, 1.5).ticks(1).crossing("min")
SQUARE = Axis.linear(-2, 2).ticks(1).crossing("min")
X = Axis.linear(0, 4).ticks(1)
Y = Axis.linear(0, 3).ticks(1)


def f(x):
    """The function of the calculus segments."""
    return 0.15 * x * x + 0.3


def lissajous(t):
    return 1.8 * math.sin(3 * t), 1.5 * math.sin(2 * t)


def quartic(x, y):
    return x**4 + y**4 - 2 * x * y - 1


def bowl(x, y):
    return x * x + y * y


def saddle(x, y):
    return x * y


def cells(count, columns=2, bands=("1fr", "5fr"), zone=None):
    """A grid of ``count`` cells in ``zone`` (the padded frame by default), each split into a label band and a body."""
    rows = -(-count // columns)
    template = Zones.grid(rows=rows, columns=columns, column_gap="72px", row_gap="48px")
    grid = zone.split(template) if zone else scene.layout.zones(
        Zones.grid(rows=rows, columns=columns, column_gap="72px", row_gap="48px", padding="page_padding")
    )
    return [cell.split(Zones.rows(list(bands))) for cell in list(grid)[:count]]


def plane_in(body, x, y, size):
    """A Cartesian plane whose plot area is ``size`` scene units, centered in ``body``."""
    plane = scene.viz.cartesian_2d(x, y, width=size[0] / ZOOM, height=size[1] / ZOOM)
    # A plane's origin is the middle of its plot area.
    return plane.scale_to(ZOOM).move_to(*body.center)


def gallery(variants, x, y, columns=2, square=False, bands=("1fr", "5fr"), zone=None):
    """Draw a plane per (label, build) cell, its label above it, and what ``build(plane)`` returns on it.

    ``build`` returns one mark or a list of them; ``x`` and ``y`` may be
    lists with one axis per cell. ``square`` plot areas keep circles round.
    """
    count = len(variants)
    xs = x if isinstance(x, list) else [x] * count
    ys = y if isinstance(y, list) else [y] * count
    planes, marks = [], []
    for (top, body), (label, build), x_axis, y_axis in zip(cells(count, columns, bands, zone), variants, xs, ys):
        scene.text(label, role="code").place(top, anchor="bottom")
        if square:
            side = min(body.width, body.height) * 0.75
            size = (side, side)
        else:
            size = (body.width * 0.75, body.height * 0.6)
        plane = plane_in(body, x_axis, y_axis, size)
        planes.append(plane)
        built = build(plane)
        marks.extend(built if isinstance(built, list) else [built])
    scene.play([plane.animate.create() for plane in planes], duration=DRAW)
    scene.play([mark.animate.create() for mark in marks], duration=DRAW)
    scene.wait(HOLD)


def curve(mark):
    """Stroke a curve with the accent."""
    return mark.stroke(accent, 0.05)


def line(mark):
    """Stroke a construction line with the foreground color."""
    return mark.no_fill().stroke(foreground, 0.035)


def area(mark):
    """Fill an area with a translucent accent."""
    return mark.fill(accent).opacity(0.45)


def over_f(plane, mark):
    """``mark`` drawn over the curve y = f(x)."""
    return [mark, curve(plane.plot(f))]


# plot() samples y = f(x) adaptively over the plane's x range, or over a
# domain; samples= fixes the number of samples instead. Marks are clipped
# to the plot area unless no_clip() lets them overflow.
scene.segment("functions")
gallery(
    [
        ("plane.plot(math.sin)", lambda plane: curve(plane.plot(math.sin))),
        ("plane.plot(math.sin, domain=(0, pi))", lambda plane: curve(plane.plot(math.sin, domain=(0, math.pi)))),
        ("plane.plot(math.sin, samples=7)", lambda plane: curve(plane.plot(math.sin, samples=7))),
        (
            "plane.plot(lambda x: 2 * sin(x))\n    .no_clip()",
            lambda plane: curve(plane.plot(lambda x: 2 * math.sin(x))).no_clip(),
        ),
    ],
    ANGLE,
    WAVE,
)

# parametric() draws t -> (x, y) and implicit() the zero set of f(x, y),
# sampled on a grid of resolution cells.
scene.segment("curves")
gallery(
    [
        ("plane.parametric(lissajous, (0, tau))", lambda plane: curve(plane.parametric(lissajous, (0, math.tau)))),
        ("plane.implicit(quartic)", lambda plane: curve(plane.implicit(quartic))),
    ],
    SQUARE,
    SQUARE,
    square=True,
    bands=("1fr", "9fr"),
)

# contour() draws one curve for each level of f(x, y).
scene.segment("contours")
gallery(
    [
        ("plane.contour(bowl,\n    levels=[0.5, 1, 2, 3])", lambda plane: curve(plane.contour(bowl, levels=[0.5, 1, 2, 3]))),
        (
            "plane.contour(saddle,\n    levels=[-1, -0.2, 0.2, 1])",
            lambda plane: curve(plane.contour(saddle, levels=[-1, -0.2, 0.2, 1])),
        ),
    ],
    SQUARE,
    SQUARE,
    square=True,
    bands=("1fr", "9fr"),
)

# Curves are sampled through the axes' scales: on a logarithmic x axis
# y = log10(x) is a straight line.
scene.segment("scales")
LOG = Axis.log(1, 1000)
LINEAR = Axis.linear(1, 1000)
gallery(
    [
        ("cartesian_2d(LOG, Y)\n    .plot(math.log10)", lambda plane: curve(plane.plot(math.log10))),
        ("cartesian_2d(LINEAR, Y)\n    .plot(math.log10)", lambda plane: curve(plane.plot(math.log10))),
    ],
    [LOG, LINEAR],
    Y,
)

# Tangent and normal lines at x, a secant through two points and the
# projections of a point onto both axes, drawn over y = f(x).
scene.segment("tangents")
gallery(
    [
        ("plane.tangent(f, 2, length=3)", lambda plane: over_f(plane, line(plane.tangent(f, 2, length=3)))),
        ("plane.normal(f, 2, length=1.5)", lambda plane: over_f(plane, line(plane.normal(f, 2, length=1.5)))),
        ("plane.secant(f, 1, 3.5)", lambda plane: over_f(plane, line(plane.secant(f, 1, 3.5)))),
        ("plane.projections(2.5, f(2.5))", lambda plane: over_f(plane, line(plane.projections(2.5, f(2.5))))),
    ],
    X,
    Y,
)

# The area between y = f(x) and a baseline, and Riemann sums of
# equal-width rectangles (twelve, at the midpoints, unless told otherwise).
scene.segment("areas")
gallery(
    [
        ("plane.area_under(f, (1, 3))", lambda plane: over_f(plane, area(plane.area_under(f, (1, 3))))),
        (
            "plane.area_under(f, (0, 4),\n    baseline=1)",
            lambda plane: over_f(plane, area(plane.area_under(f, (0, 4), baseline=1))),
        ),
        ("plane.riemann_sum(f, (0, 4))", lambda plane: over_f(plane, area(plane.riemann_sum(f, (0, 4))))),
        (
            "plane.riemann_sum(f, (0, 4),\n    rectangles=4)",
            lambda plane: over_f(plane, area(plane.riemann_sum(f, (0, 4), rectangles=4))),
        ),
    ],
    X,
    Y,
)

# method picks where each rectangle meets the curve.
scene.segment("riemann_methods")
header, body = scene.layout.zones(Zones.rows(["1fr", "7fr"], gap="24px", padding="page_padding"))
scene.text("plane.riemann_sum(f, (0, 4), rectangles=6, method=...)", role="code").place(header, anchor="bottom")
gallery(
    [
        (
            f'method="{method}"',
            lambda plane, method=method: over_f(plane, area(plane.riemann_sum(f, (0, 4), rectangles=6, method=method))),
        )
        for method in ("left", "midpoint", "right")
    ],
    X,
    Y,
    columns=3,
    bands=("1fr", "6fr"),
    zone=body,
)

# inputs= passes reactive values after x, so the curve is rebuilt whenever
# they change: a parameter, or the time itself.
scene.segment("reactive")
amplitude = scene.viz.parameter(0.5)
waves = []
for (top, body), (label, build) in zip(
    cells(2, bands=("1fr", "3fr")),
    [
        (
            "plane.plot(\n    lambda x, a: a * sin(x),\n    inputs=[amplitude])",
            lambda plane: plane.plot(lambda x, a: a * math.sin(x), inputs=[amplitude]),
        ),
        (
            "plane.plot(\n    lambda x, t: sin(x - 2 * t),\n    inputs=[scene.viz.time])",
            lambda plane: plane.plot(lambda x, t: math.sin(x - 2 * t), inputs=[scene.viz.time]),
        ),
    ],
):
    scene.text(label, role="code").place(top, anchor="bottom_left")
    plane = plane_in(body, ANGLE, WAVE, (body.width * 0.75, body.height * 0.6))
    waves.append((plane, curve(build(plane))))
scene.play([part.animate.create() for pair in waves for part in pair], duration=DRAW)
scene.play([amplitude.animate.set(1.4)], duration=1.5)
scene.play([amplitude.animate.set(0.5)], duration=1.5)
scene.wait(HOLD)

if snapshots := os.environ.get("GAANIM_SNAPSHOTS"):
    # Each gallery drawn (and the first one while its curves draw), then the
    # reactive curves at both amplitudes.
    scene.snapshots(snapshots, [1.8] + [STEP * index + 3.1 for index in range(7)] + [STEP * 7 + 2.7, STEP * 7 + 4.2])
else:
    scene.render()
Chart marks
Every chart mark: points, lines, steps, areas, bars, histograms, box plots, violins, error bars, heatmaps, and pies, donuts and roses.
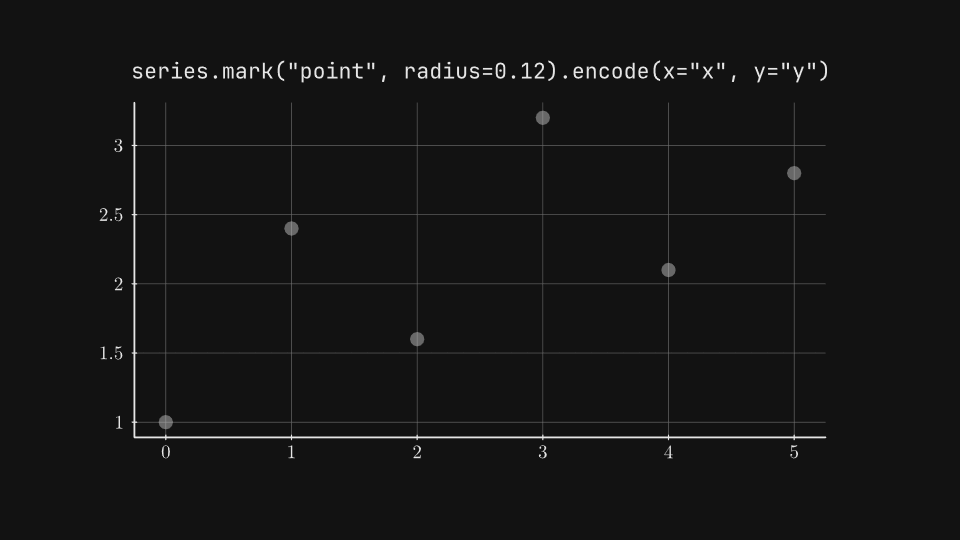
gaanim examples/visualization/chart_marks.pyCode · 167 lines
"""Chart marks: points, lines, steps, areas, bars, histograms, box plots, violins, error bars, heatmaps and arcs.

``ChartSpec`` is an immutable recipe of data, a mark, encodings, axes and
guides; ``scene.viz.chart(spec)`` draws it, inferring the axes it is not
given from the data. Each segment draws one mark at the chart's full size,
labelled with the spec that builds it.
"""

import math
import os
import random

from gaanim import Axis, ChartSpec, Scene, Value, Zones

DRAW = 0.8
HOLD = 0.8
# A segment draws the axes, then the marks, then holds.
STEP = 2 * DRAW + HOLD

scene = Scene()
chart_color = scene.canvas.color("chart")

# One observation per row: x, y and how far its error reaches below and
# above y.
SERIES = {
    "x": [0, 1, 2, 3, 4, 5],
    "y": [1.0, 2.4, 1.6, 3.2, 2.1, 2.8],
    "below": [0.4, 0.5, 0.4, 0.6, 0.5, 0.5],
    "above": [0.5, 0.4, 0.5, 0.5, 0.4, 0.6],
}
# Elapsed time of four methods, for bars on a category axis.
METHODS = {"method": ["Baseline", "Cached", "GPU", "Optimized"], "elapsed": [48, 32, 21, 15]}
# Two hundred draws from a normal distribution, for the distribution marks.
draws = random.Random(7)
SAMPLES = {"value": [draws.gauss(5, 1.5) for _ in range(200)]}
# A 9 x 6 grid of cells with a value each, for the heatmap.
GRID = [(x, y, math.sin(x / 2) * math.cos(y / 2)) for y in range(6) for x in range(9)]
CELLS = {"x": [x for x, _, _ in GRID], "y": [y for _, y, _ in GRID], "value": [v for _, _, v in GRID]}
# The share of each source in a power grid, and how much each one grew, for
# the arcs.
ENERGY = {
    "source": ["Solar", "Wind", "Hydro", "Gas"],
    "share": [36, 27, 20, 17],
    "growth": [9, 6, 2, 3],
}

series = ChartSpec(SERIES)


def show(label, spec, style=None):
    """Draw ``spec`` at its default size and place, its label above it.

    ``style(marks)`` restyles the marks layer when given.
    """
    top, _ = scene.layout.zones(Zones.rows(["1fr", "8fr"], padding="page_padding"))
    text = scene.text(label, role="code").place(top, anchor="bottom")
    chart = scene.viz.chart(spec)
    if style:
        style(chart.layer("marks"))
    scene.play([chart.layer("axes").animate.create(), text.animate.fade_in()], duration=DRAW)
    scene.play([chart.layer("marks").animate.fade_in()], duration=DRAW)
    scene.wait(HOLD)


def show_arc(label, spec):
    """Grow the arc chart ``spec`` around its center, its label above it."""
    top, _ = scene.layout.zones(Zones.rows(["1fr", "8fr"], padding="page_padding"))
    text = scene.text(label, role="code").place(top, anchor="bottom")
    chart = scene.viz.chart(spec)
    scene.play([chart.animate.grow(), text.animate.fade_in()], duration=2 * DRAW)
    scene.wait(HOLD)


# point, line, step and area draw one series of (x, y) rows; radius sizes
# the points.
scene.segment("point")
show('series.mark("point", radius=0.12).encode(x="x", y="y")', series.mark("point", radius=0.12).encode(x="x", y="y"))

scene.segment("line")
show('series.mark("line").encode(x="x", y="y")', series.mark("line").encode(x="x", y="y"))

scene.segment("step")
show('series.mark("step").encode(x="x", y="y")', series.mark("step").encode(x="x", y="y"))

scene.segment("area")
show('series.mark("area").encode(x="x", y="y")', series.mark("area").encode(x="x", y="y"))

# A bar per row; on a category axis width is the share of each band. The
# label channel writes a value at the end of each bar.
scene.segment("bar")
show(
    'ChartSpec(METHODS).mark("bar", width=0.6)\n'
    '    .encode(x="method", y="elapsed", label="elapsed")\n'
    '    .axes(y=Axis.linear(0, 55).ticks(10).label("ms"))',
    ChartSpec(METHODS)
    .mark("bar", width=0.6)
    .encode(x="method", y="elapsed", label="elapsed")
    .axes(y=Axis.linear(0, 55).ticks(10).label("ms")),
)

# The distribution marks summarize one column: a histogram counts it in
# bins, a box plot draws its quartiles and a violin its estimated density.
# Box and violin stand at x = center (0 by default), the first band of a
# category axis. The box is outlined here so its median and whiskers show.
scene.segment("histogram")
show('ChartSpec(SAMPLES).mark("histogram", bins=12).encode(x="value")', ChartSpec(SAMPLES).mark("histogram", bins=12).encode(x="value"))

scene.segment("box")
show(
    'ChartSpec(SAMPLES).mark("box", width=0.4).encode(y="value")\n    .axes(x=Axis.category(["value"]))',
    ChartSpec(SAMPLES).mark("box", width=0.4).encode(y="value").axes(x=Axis.category(["value"])),
    style=lambda marks: marks.no_fill().stroke(chart_color, 0.04),
)

scene.segment("violin")
show(
    'ChartSpec(SAMPLES).mark("violin", bandwidth=0.5).encode(y="value")\n    .axes(x=Axis.category(["value"]))',
    ChartSpec(SAMPLES).mark("violin", bandwidth=0.5).encode(y="value").axes(x=Axis.category(["value"])),
)

# Error bars reach the low column's value below each y and the high
# column's above it.
scene.segment("error_bar")
show(
    'series.mark("error_bar", low="below", high="above", cap_width=0.2)\n    .encode(x="x", y="y")',
    series.mark("error_bar", low="below", high="above", cap_width=0.2).encode(x="x", y="y"),
)

# A heatmap colors each cell by the color column, quantized into bands of
# the theme's heatmap palette.
scene.segment("heatmap")
show(
    'ChartSpec(CELLS).mark("heatmap", bands=8)\n    .encode(x="x", y="y", color="value")',
    ChartSpec(CELLS).mark("heatmap", bands=8).encode(x="x", y="y", color="value"),
)

# An arc gives each row its share of the theta total, clockwise from 12
# o'clock, with no axes; grow() turns a hand from there and opens each
# slice, then its label, as the hand crosses it.
# inner_radius leaves the middle empty for a donut and pad_angle separates
# the slices; a radius field draws a rose, each slice reaching out in
# proportion to its value.
scene.segment("arc")
show_arc(
    'ChartSpec(ENERGY).mark("arc")\n    .encode(theta="share", color="source", label="source")',
    ChartSpec(ENERGY).mark("arc").encode(theta="share", color="source", label="source"),
)

scene.segment("donut")
show_arc(
    'ChartSpec(ENERGY).mark("arc", inner_radius=0.6, pad_angle=0.03)\n    .encode(theta="share", color="source", label="share")',
    ChartSpec(ENERGY).mark("arc", inner_radius=0.6, pad_angle=0.03).encode(theta="share", color="source", label="share"),
)

scene.segment("rose")
show_arc(
    'ChartSpec(ENERGY).mark("arc", inner_radius=0.2)\n    .encode(theta=Value(1), radius="growth", color="source")',
    ChartSpec(ENERGY).mark("arc", inner_radius=0.2).encode(theta=Value(1), radius="growth", color="source"),
)

if snapshots := os.environ.get("GAANIM_SNAPSHOTS"):
    # The first chart while its marks fade in, then every chart drawn, and
    # the first arc halfway through its growth.
    scene.snapshots(snapshots, [1.2] + [STEP * index + 2.2 for index in range(13)] + [STEP * 10 + 0.8])
else:
    scene.render()
Chart encodings
Color, size, opacity and label channels, scales, categorical palettes, legends and color bars, and explicit axes.
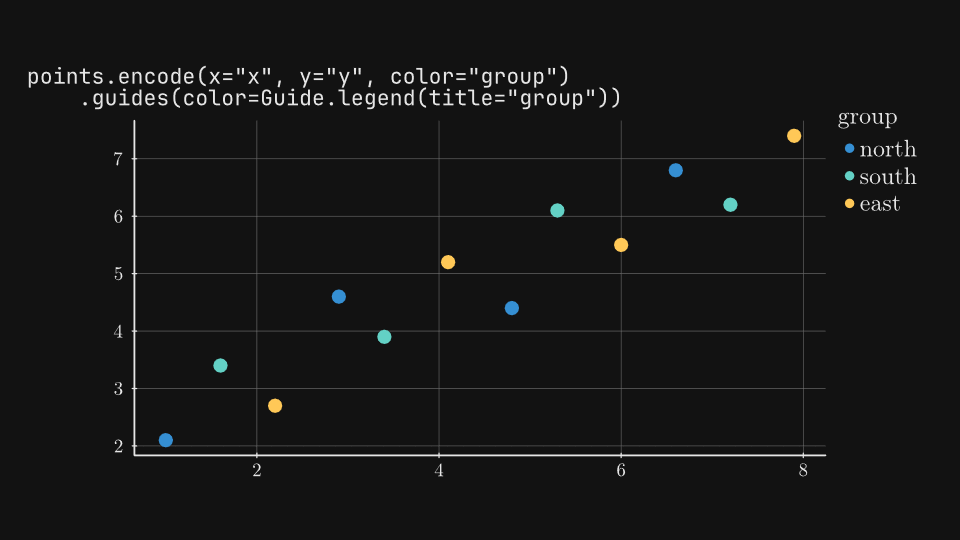
gaanim examples/visualization/chart_encodings.pyCode · 173 lines
"""Chart encodings: color, size, opacity and label channels, scales, palettes, guides and explicit axes.

``ChartSpec.encode`` maps columns to channels. A channel takes a column
name, ``Field(column, scale=...)`` when the scale matters, or ``Value(...)``
for a constant. Guides (legends and colorbars) explain the color, size and
opacity channels, and ``axes`` replaces the inferred axes. Each segment
draws one chart at its full size, labelled with the spec that builds it.
"""

import os

from gaanim import Axis, ChartSpec, Field, Guide, Scale, Scene, Value, Zones

DRAW = 0.8
HOLD = 1.0
# A segment draws the axes, then the marks and guides, then holds.
STEP = 2 * DRAW + HOLD

scene = Scene()
accent = scene.canvas.color("accent")
success = scene.canvas.color("success")
danger = scene.canvas.color("danger")
warning = scene.canvas.color("warning")
background = scene.canvas.color("background")

# Twelve observations: a position, a group, a weight and a confidence.
POINTS = {
    "x": [1.0, 1.6, 2.2, 2.9, 3.4, 4.1, 4.8, 5.3, 6.0, 6.6, 7.2, 7.9],
    "y": [2.1, 3.4, 2.7, 4.6, 3.9, 5.2, 4.4, 6.1, 5.5, 6.8, 6.2, 7.4],
    "group": ["north", "south", "east", "north", "south", "east", "north", "south", "east", "north", "south", "east"],
    "weight": [1, 4, 2, 8, 3, 6, 9, 2, 5, 7, 4, 10],
    "confidence": [0.2, 0.9, 0.5, 0.7, 0.3, 1.0, 0.6, 0.4, 0.8, 0.5, 0.9, 0.3],
}
# Monthly values of three cities, one row per city and month.
MONTHS = list(range(1, 9))
LEVELS = {"Lima": [3, 4, 4, 6, 7, 7, 8, 9], "Cusco": [1, 2, 4, 3, 5, 6, 6, 7], "Puno": [2, 2, 3, 3, 3, 4, 5, 5]}
CITIES = {
    "month": [month for _ in LEVELS for month in MONTHS],
    "value": [value for values in LEVELS.values() for value in values],
    "city": [city for city in LEVELS for _ in MONTHS],
}
# Yearly changes, positive and negative.
CHANGES = {
    "year": ["2019", "2020", "2021", "2022", "2023"],
    "change": [12, -18, 7, 15, -4],
    "kind": ["gain", "loss", "gain", "gain", "loss"],
}
# Visitors of eight regions, one bar each.
REGIONS = {
    "region": ["Amazonas", "Ancash", "Arequipa", "Cusco", "Ica", "Junin", "Lima", "Piura"],
    "visitors": [18, 26, 41, 63, 22, 15, 88, 30],
}
# Populations over four orders of magnitude.
TOWNS = {"population": [40, 220, 900, 3100, 12000, 34000, 81000], "share": [0.12, 0.25, 0.31, 0.46, 0.58, 0.71, 0.86]}

points = ChartSpec(POINTS).mark("point", radius=0.12)


def show(label, spec, guides=True):
    """Draw ``spec`` a little below its default place, its label above it.

    ``guides`` says whether the spec has a legend or colorbar to bring in.
    """
    top, _ = scene.layout.zones(Zones.rows(["1fr", "5fr"], padding="page_padding"))
    text = scene.text(label, role="code").place(top, anchor="bottom_left")
    chart = scene.viz.chart(spec).move_to(0, -0.3)
    scene.play([chart.layer("axes").animate.create(), text.animate.fade_in()], duration=DRAW)
    layers = ["marks", "guides"] if guides else ["marks"]
    scene.play([chart.layer(name).animate.fade_in() for name in layers], duration=DRAW)
    scene.wait(HOLD)


# A text column on color is categorical: each group gets a color of the
# categorical palette, listed by a legend in order of appearance.
scene.segment("color_groups")
show(
    'points.encode(x="x", y="y", color="group")\n    .guides(color=Guide.legend(title="group"))',
    points.encode(x="x", y="y", color="group").guides(color=Guide.legend(title="group")),
)

# Scale.category fixes the order of the groups and colors() their colors.
scene.segment("color_scale")
palette = Scale.category(["north", "south", "east"]).colors([accent, success, danger])
show(
    'palette = Scale.category(["north", "south", "east"])\n'
    "    .colors([accent, success, danger])\n"
    'points.encode(x="x", y="y", color=Field("group", scale=palette))',
    points.encode(x="x", y="y", color=Field("group", scale=palette)).guides(color=Guide.legend()),
)

# A numeric column on color maps its domain through a continuous scale; a
# colorbar is the guide of a continuous channel.
scene.segment("color_numeric")
show(
    'points.encode(x="x", y="y",\n'
    '    color=Field("weight", scale=Scale.linear((0, 10))))\n'
    '    .guides(color=Guide.colorbar(title="weight"))',
    points.encode(x="x", y="y", color=Field("weight", scale=Scale.linear((0, 10)))).guides(
        color=Guide.colorbar(title="weight")
    ),
)

# size takes the point radius from a column (0.03 to 0.12 scene units, by
# area) and opacity the transparency; Value() makes any channel constant.
scene.segment("size_opacity")
show(
    'ChartSpec(POINTS).mark("point").encode(x="x", y="y",\n'
    '    size="weight", opacity="confidence", color=Value(accent))',
    ChartSpec(POINTS).mark("point").encode(x="x", y="y", size="weight", opacity="confidence", color=Value(accent)),
    guides=False,
)

# On a line, step or area mark a categorical color draws one series per
# category.
scene.segment("series")
show(
    'ChartSpec(CITIES).mark("line")\n'
    '    .encode(x="month", y="value", color="city")\n'
    '    .guides(color=Guide.legend(title="city"))',
    ChartSpec(CITIES).mark("line").encode(x="month", y="value", color="city").guides(color=Guide.legend(title="city")),
)

# Bar labels sit past the bar's end by default, or inside it in their own
# color. Bars grow from zero both ways; crossing("min") keeps the year axis
# at the bottom, clear of the bars that go down.
scene.segment("bar_labels")
gains = Scale.category(["gain", "loss"]).colors([success, danger])
changes = (
    ChartSpec(CHANGES)
    .encode(x="year", y="change", label="change", color=Field("kind", scale=gains))
    .axes(y=Axis.linear(-20, 20).ticks(10).crossing("min"))
)
show(
    'changes.mark("bar", label_position="inside", label_color=background)',
    changes.mark("bar", label_position="inside", label_color=background),
    guides=False,
)

# axes() replaces the inferred axes: here a logarithmic x and a y in
# percent. An explicit domain is kept as given.
scene.segment("axes")
show(
    'ChartSpec(TOWNS).mark("line").encode(x="population", y="share")\n'
    '    .axes(x=Axis.log(10, 100000).label("population", position="center"),\n'
    '          y=Axis.linear(0, 1).numbers("percent", precision=0))',
    ChartSpec(TOWNS)
    .mark("line")
    .encode(x="population", y="share")
    .axes(
        x=Axis.log(10, 100000).label("population", position="center"),
        y=Axis.linear(0, 1).numbers("percent", precision=0),
    ),
    guides=False,
)

# colors() also takes a Palette or a palette's name. Categories take its
# colors in turn; past the last one it goes round again a shade lighter, so
# the eighth region differs from the first. Theme(palette=...) sets the
# palette of every chart in the scene.
scene.segment("palette")
show(
    'ChartSpec(REGIONS).mark("bar").encode(x="region", y="visitors",\n'
    '    color=Field("region", scale=Scale.category().colors("okabe_ito")))',
    ChartSpec(REGIONS).mark("bar").encode(x="region", y="visitors", color=Field("region", scale=Scale.category().colors("okabe_ito"))),
    guides=False,
)

if snapshots := os.environ.get("GAANIM_SNAPSHOTS"):
    # Every chart once its marks and guides are in.
    scene.snapshots(snapshots, [STEP * index + 2.4 for index in range(8)])
else:
    scene.render()
Chart transitions
Charts that morph between specs by key or index, change mark family or data, grow from 2D into 3D, and pies that share out their slices anew.
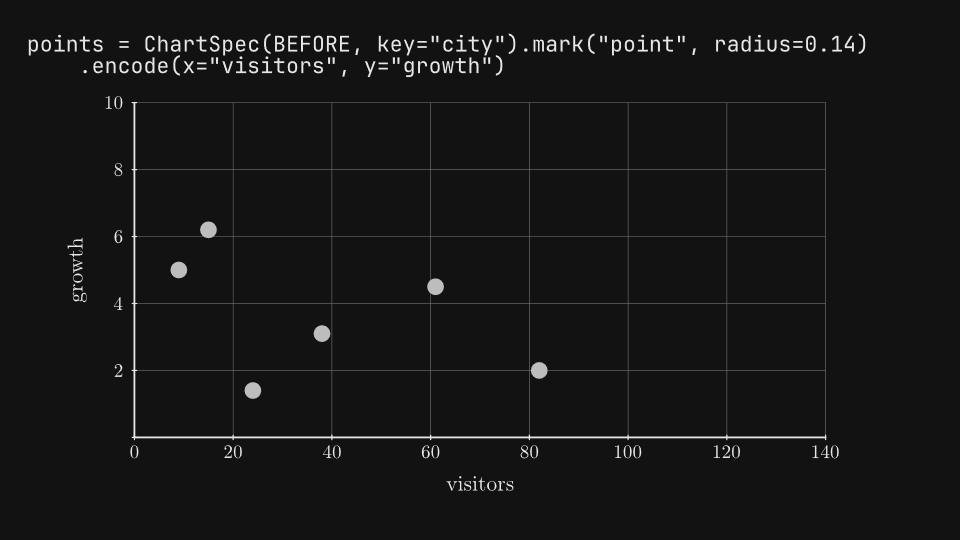
gaanim examples/visualization/chart_transitions.pyCode · 201 lines
"""Chart transitions: morphing between specs by key or index, new mark families, changing data, 2D to 3D and arcs.

``chart.animate.to(spec)`` animates a chart into another recipe: marks
matched by their key column (or by row index) move and reshape, the rest
fades, and the target chart replaces the first when the clip ends. Each
segment runs one transition, labelled with its code.
"""

import math
import os

from gaanim import Axis, ChartSpec, DataSource, Field, Scale, Scene, Value, Zones

DRAW = 0.8
MORPH = 1.6
HOLD = 0.8
# A segment draws a chart, holds, swaps its label, transitions and holds.
STEP = 2 * DRAW + 2 * HOLD + 0.4 + MORPH

scene = Scene()
accent = scene.canvas.color("accent")

# The same six cities in two years: their key column, "city", ties each row
# of one spec to the row of the other.
BEFORE = {
    "city": ["Lima", "Cusco", "Arequipa", "Puno", "Piura", "Iquitos"],
    "visitors": [82, 61, 38, 15, 24, 9],
    "growth": [2.0, 4.5, 3.1, 6.2, 1.4, 5.0],
}
AFTER = {
    "city": ["Lima", "Cusco", "Arequipa", "Puno", "Piura", "Iquitos"],
    "visitors": [112, 121, 70, 52, 56, 79],
    "growth": [3.1, 6.8, 4.0, 7.5, 2.2, 9.4],
}
AXES = {
    "x": Axis.linear(0, 140).ticks(20).label("visitors", position="center"),
    "y": Axis.linear(0, 10).ticks(2).label("growth", position="center"),
}


def label(text):
    """Write a code label above the chart, hidden until faded in."""
    top, _ = scene.layout.zones(Zones.rows(["1fr", "9fr"], padding="page_padding"))
    return scene.text(text, role="code").place(top, anchor="bottom_left").hidden()


def transition(first, setup, target, then, **options):
    """Draw ``first`` with the ``setup`` label, then run ``to(target)`` under the ``then`` label."""
    before, after = label(setup), label(then)
    chart = scene.viz.chart(first)
    scene.play([chart.layer("axes").animate.create(), before.animate.fade_in()], duration=DRAW)
    scene.play([chart.layer("marks").animate.fade_in()], duration=DRAW)
    scene.wait(HOLD)
    scene.play([before.animate.fade_out(), after.animate.fade_in()], duration=0.4)
    scene.play([chart.animate.to(target, **options)], duration=MORPH)
    scene.wait(HOLD)
    return chart


# Matched by key, each point moves from its old values to its new ones.
scene.segment("by_key")
points = ChartSpec(BEFORE, key="city").mark("point", radius=0.14).encode(x="visitors", y="growth").axes(**AXES)
moved = ChartSpec(AFTER, key="city").mark("point", radius=0.14).encode(x="visitors", y="growth").axes(**AXES)
transition(
    points,
    'points = ChartSpec(BEFORE, key="city").mark("point", radius=0.14)\n    .encode(x="visitors", y="growth")',
    moved,
    'chart.animate.to(ChartSpec(AFTER, key="city").mark("point", radius=0.14)\n    .encode(x="visitors", y="growth"))',
)

# A new encoding is a new spec too: encode() replaces the channels it names
# and keeps the others, and the axes follow the new values.
scene.segment("encodings")
bars = ChartSpec(BEFORE, key="city").mark("bar", width=0.6).encode(x="city", y="visitors")
transition(
    bars,
    'bars = ChartSpec(BEFORE, key="city").mark("bar", width=0.6)\n    .encode(x="city", y="visitors")',
    bars.encode(y="growth", color=Value(accent)),
    'chart.animate.to(bars.encode(y="growth", color=Value(accent)))',
)

# Specs without a key match their rows in order with match_="index".
scene.segment("by_index")
WAVE = {"t": [i / 4 for i in range(25)], "y": [math.sin(i / 4) for i in range(25)]}
WAVE2 = {"t": WAVE["t"], "y": [0.5 * math.sin(i / 2) + 0.4 for i in range(25)]}
transition(
    ChartSpec(WAVE).mark("line").encode(x="t", y="y"),
    'ChartSpec(WAVE).mark("line").encode(x="t", y="y")',
    ChartSpec(WAVE2).mark("line").encode(x="t", y="y"),
    'chart.animate.to(ChartSpec(WAVE2).mark("line").encode(x="t", y="y"),\n    match_="index")',
    match_="index",
)

# Marks of different families cannot morph into each other; fallback=
# "crossfade" fades from one chart to the other instead of failing.
scene.segment("crossfade")
transition(
    bars,
    'bars = ChartSpec(BEFORE, key="city").mark("bar", width=0.6)\n    .encode(x="city", y="visitors")',
    points,
    'chart.animate.to(points, fallback="crossfade")',
    fallback="crossfade",
)

# A DataSource is a table that changes: after append() or replace(), a new
# ChartSpec captures its new version, and the chart animates to it. sales()
# builds that spec: an area of sales per day on fixed axes.
scene.segment("data_source")
source = DataSource({"day": [0, 1, 2, 3], "sales": [3, 5, 4, 6]})


def sales():
    return ChartSpec(source).mark("area").encode(x="day", y="sales").axes(x=Axis.linear(0, 7), y=Axis.linear(0, 10))


first = sales()
source.append({"day": [4, 5, 6, 7], "sales": [7, 6, 8, 9]})
transition(
    first,
    'source = DataSource({"day": [0, 1, 2, 3], "sales": [3, 5, 4, 6]})\nchart = scene.viz.chart(sales())',
    sales(),
    'source.append({"day": [4, 5, 6, 7], "sales": [7, 6, 8, 9]})\nchart.animate.to(sales(), match_="index")',
    match_="index",
)

# point, line and bar charts pass to 3D when they gain a z encoding; the
# camera moves on its own, alongside.
scene.segment("to_3d")
GROUPS = Scale.category(["coast", "andes", "jungle"])
flat = (
    ChartSpec({**BEFORE, "region": ["coast", "andes", "coast", "andes", "coast", "jungle"]}, key="city")
    .mark("point")
    .encode(x="visitors", y="growth", color=Field("region", scale=GROUPS), size=Value(0.2))
    .axes(**AXES)
)
deep = flat.encode(z="growth").axes(z=Axis.linear(0, 10).ticks(2).label("z"))
before, after = label('flat = points.encode(color=Field("region"))'), label('chart.animate.to(flat.encode(z="growth"))')
chart = scene.viz.chart(flat)
scene.play([chart.layer("axes").animate.create(), before.animate.fade_in()], duration=DRAW)
scene.play([chart.layer("marks").animate.fade_in()], duration=DRAW)
scene.wait(HOLD)
scene.play([before.animate.fade_out(), after.animate.fade_in()], duration=0.4)
scene.camera.perspective(fov_y=0.785, near=0.1, far=1000)
scene.play([chart.animate.to(deep), scene.camera.animate.look_at(eye=(9, 7, 11), target=(0, 0, 0))], duration=MORPH)
scene.wait(HOLD)

# A heatmap and a surface share their grid of cells, so one becomes the other.
scene.segment("heatmap_to_surface")
scene.camera.reset()
GRID = [(x, y, math.sin(x) * math.cos(y)) for y in range(-2, 3) for x in range(-2, 3)]
CELLS = {
    "cell": [f"{x}:{y}" for x, y, _ in GRID],
    "x": [x for x, _, _ in GRID],
    "y": [y for _, y, _ in GRID],
    "value": [value for _, _, value in GRID],
}
# crossing("min") keeps the heatmap's axes on its edges, off the cells.
EDGES = {"x": Axis.linear(-2.5, 2.5).ticks(1).crossing("min"), "y": Axis.linear(-2.5, 2.5).ticks(1).crossing("min")}
cells = ChartSpec(CELLS, key="cell").axes(**EDGES)
heatmap = cells.mark("heatmap", bands=12).encode(x="x", y="y", color="value")
surface = cells.mark("surface").encode(x="x", y="y", z="value", color="value")
before = label('cells = ChartSpec(CELLS, key="cell").axes(**EDGES)\ncells.mark("heatmap", bands=12).encode(x="x", y="y", color="value")')
after = label('chart.animate.to(cells.mark("surface")\n    .encode(x="x", y="y", z="value", color="value"))')
chart = scene.viz.chart(heatmap)
scene.play([chart.layer("axes").animate.create(), before.animate.fade_in()], duration=DRAW)
scene.play([chart.layer("marks").animate.fade_in()], duration=DRAW)
scene.wait(HOLD)
scene.play([before.animate.fade_out(), after.animate.fade_in()], duration=0.4)
scene.camera.perspective(fov_y=0.785, near=0.1, far=1000)
scene.play([chart.animate.to(surface), scene.camera.animate.look_at(eye=(13, 10, 15), target=(0, 0, 0))], duration=MORPH)
scene.wait(HOLD)

# Between two arc charts each slice sweeps to the share of its key; a city
# that leaves closes on its middle angle and one that arrives opens from it.
scene.segment("arc")
scene.camera.reset()
TRIPS = {"city": ["Lima", "Cusco", "Arequipa", "Puno"], "visitors": [82, 61, 38, 15]}
LATER = {"city": ["Lima", "Cusco", "Arequipa", "Iquitos"], "visitors": [112, 121, 70, 79]}
pie = ChartSpec(TRIPS, key="city").mark("arc", inner_radius=0.5).encode(theta="visitors", color="city", label="city")
before = label('pie = ChartSpec(TRIPS, key="city").mark("arc", inner_radius=0.5)\n    .encode(theta="visitors", color="city", label="city")')
after = label('chart.animate.to(ChartSpec(LATER, key="city").mark("arc", inner_radius=0.5)\n    .encode(theta="visitors", color="city", label="city"))')
chart = scene.viz.chart(pie)
scene.play([chart.animate.grow(), before.animate.fade_in()], duration=2 * DRAW)
scene.wait(HOLD)
scene.play([before.animate.fade_out(), after.animate.fade_in()], duration=0.4)
later = ChartSpec(LATER, key="city").mark("arc", inner_radius=0.5).encode(theta="visitors", color="city", label="city")
scene.play([chart.animate.to(later)], duration=MORPH)
scene.wait(HOLD)

if snapshots := os.environ.get("GAANIM_SNAPSHOTS"):
    # Each segment before and after its transition, and the 3D ones and the
    # arcs halfway.
    scene.snapshots(
        snapshots,
        [STEP * index + t for index in range(7) for t in (2.2, 5.0)]
        + [STEP * 5 + 3.6, STEP * 6 + 3.6]
        + [STEP * 7 + t for t in (2.2, 3.6, 5.0)],
    )
else:
    scene.render()
Bar race
Ranked bars that grow, overtake each other and leave the top, with value formats, colors and a rolling ticker.
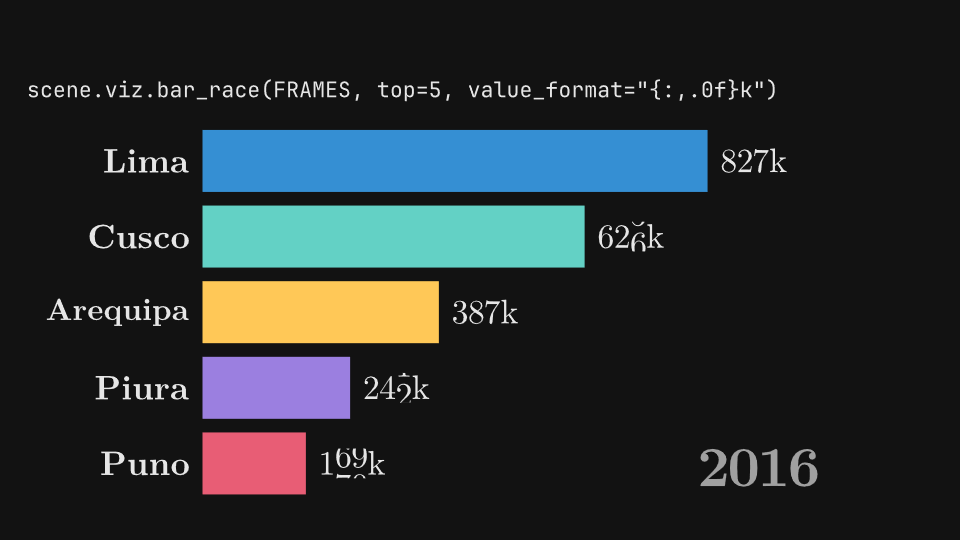
gaanim examples/visualization/bar_race.pyCode · 129 lines
"""Bar race: ranked bars that grow, overtake each other and leave the top, with a rolling ticker.

``scene.viz.bar_race`` takes one ``{name: value}`` table per keyframe and
interpolates between them; the whole race is a function of one keyframe
position, so seeking shows the same frame as playing. The first segment
runs a race, the next ones compare options side by side, and the last one
drives the position by hand.
"""

import os

from gaanim import Scene, Zones

RACE = 8.0
HOLD = 0.6
# The first three segments each run a race and hold.
STEP = RACE + HOLD

scene = Scene()
accent = scene.canvas.color("accent")
success = scene.canvas.color("success")
warning = scene.canvas.color("warning")
danger = scene.canvas.color("danger")
chart = scene.canvas.color("chart")
muted = scene.canvas.color("muted")

# Visitors per year, in thousands; a city missing from a year counts as zero.
FRAMES = {
    2016: {"Lima": 820, "Cusco": 610, "Arequipa": 380, "Puno": 150, "Piura": 240, "Iquitos": 90},
    2017: {"Lima": 860, "Cusco": 700, "Arequipa": 420, "Puno": 260, "Piura": 250, "Iquitos": 130},
    2018: {"Lima": 880, "Cusco": 910, "Arequipa": 470, "Puno": 390, "Piura": 300, "Iquitos": 210},
    2019: {"Lima": 930, "Cusco": 1040, "Arequipa": 520, "Puno": 560, "Piura": 330, "Iquitos": 340},
    2020: {"Lima": 410, "Cusco": 300, "Arequipa": 210, "Puno": 230, "Piura": 190, "Iquitos": 180},
    2021: {"Lima": 640, "Cusco": 520, "Arequipa": 380, "Puno": 330, "Piura": 420, "Iquitos": 260},
    2022: {"Lima": 990, "Cusco": 980, "Arequipa": 610, "Puno": 450, "Piura": 520, "Iquitos": 600},
    2023: {"Lima": 1120, "Cusco": 1210, "Arequipa": 700, "Puno": 520, "Piura": 560, "Iquitos": 790},
}


def labelled(zone, label, **options):
    """A race in ``zone`` below its code label.

    The race's width covers names and bars; the numbers past the longest
    bar take the last eighth of the zone.
    """
    top, body = zone.split(Zones.rows(["2fr", "11fr"], gap="24px"))
    scene.text(label, role="code").place(top, anchor="bottom_left")
    width = body.width * 0.875
    race = scene.viz.bar_race(FRAMES, width=width, height=body.height * 0.95, **options)
    return race.move_to(body.left + width / 2, body.center[1])


def compare(left, right):
    """Run two races side by side; ``left`` and ``right`` are (label, options) pairs."""
    columns = scene.layout.zones(Zones.columns(2, gap="96px", padding="page_padding"))
    races = [labelled(zone, label, **options) for zone, (label, options) in zip(columns, [left, right])]
    scene.play([race.animate.play().duration(RACE) for race in races])
    scene.wait(HOLD)


# top= keeps the leaders, value_format= formats the numbers rolling at the
# end of each bar, and the ticker rolls through the keyframe labels.
scene.segment("race")
frame = scene.layout.zones(Zones.rows(1, padding="page_padding"))[0]
race = labelled(frame, 'scene.viz.bar_race(FRAMES, top=5, value_format="{:,.0f}k")', top=5, value_format="{:,.0f}k")
scene.play([race.animate.play().duration(RACE)])
scene.wait(HOLD)

# rank_smoothing is how many keyframes a swap between two bars takes; with
# 0 they trade places at once. The side-by-side races share smaller text:
# SIDE = dict(top=4, label_width=1.9, font_size=0.36, ticker_size=0.6).
scene.segment("rank_smoothing")
SIDE = {"top": 4, "label_width": 1.9, "font_size": 0.36, "ticker_size": 0.6}
compare(
    ("bar_race(FRAMES, **SIDE,\n         rank_smoothing=0)", {**SIDE, "rank_smoothing": 0}),
    ("bar_race(FRAMES, **SIDE,\n         rank_smoothing=1.5)", {**SIDE, "rank_smoothing": 1.5}),
)

# colors= maps names to colors (or lists colors to cycle); bar_gap= is the
# empty share of each slot and ticker=False hides the keyframe label.
scene.segment("style")
COLORS = {"Lima": accent, "Cusco": success, "Arequipa": warning, "Puno": danger, "Piura": chart, "Iquitos": muted}
compare(
    ("bar_race(FRAMES, **SIDE,\n         colors=COLORS)", {**SIDE, "colors": COLORS}),
    (
        'bar_race(FRAMES, **SIDE,\n         bar_gap=0.5, ticker=False,\n         value_format="${:,.1f}")',
        {**SIDE, "bar_gap": 0.5, "ticker": False, "value_format": "${:,.1f}"},
    ),
)

# animate.to(position) runs to any keyframe position, fractional or
# backwards, and set(position) jumps there. bar(name) is one row (name, bar
# and number) that moves between slots: here it takes the accent.
scene.segment("position")
frame = scene.layout.zones(Zones.rows(["1fr", "8fr"], padding="page_padding"))
race = scene.viz.bar_race(FRAMES, top=6, width=frame[1].width, height=frame[1].height * 0.95)
race.move_to(*frame[1].center)


def highlight():
    race.bar("Iquitos").fill(accent)
    return []


shown = None
for label, action in [
    ("race.animate.to(3)", lambda: [race.animate.to(3).duration(2)]),
    ("race.animate.to(1)", lambda: [race.animate.to(1).duration(1.5)]),
    ('race.bar("Iquitos").fill(accent)', highlight),
    ("race.animate.to(7)", lambda: [race.animate.to(7).duration(3)]),
]:
    text = scene.text(label, role="code").place(frame[0], anchor="bottom_left").hidden()
    swap = [text.animate.fade_in().duration(0.4)] + ([shown.animate.fade_out().duration(0.4)] if shown else [])
    scene.play(swap + action())
    shown = text
scene.wait(HOLD)

if snapshots := os.environ.get("GAANIM_SNAPSHOTS"):
    # The race at its start, overtakes, the 2020 drop and its end; the two
    # comparisons mid-race and at the end; the position steps.
    scene.snapshots(
        snapshots,
        [0.2, 2.6, 4.6, 8.2]
        + [STEP * index + t for index in (1, 2) for t in (2.6, 8.2)]
        + [STEP * 3 + t for t in (2.0, 3.5, 4.0, 7.3)],
    )
else:
    scene.render()
Vector fields
Vector fields as arrows and streamlines with their options, flowing highlights, particles, advection and color maps.
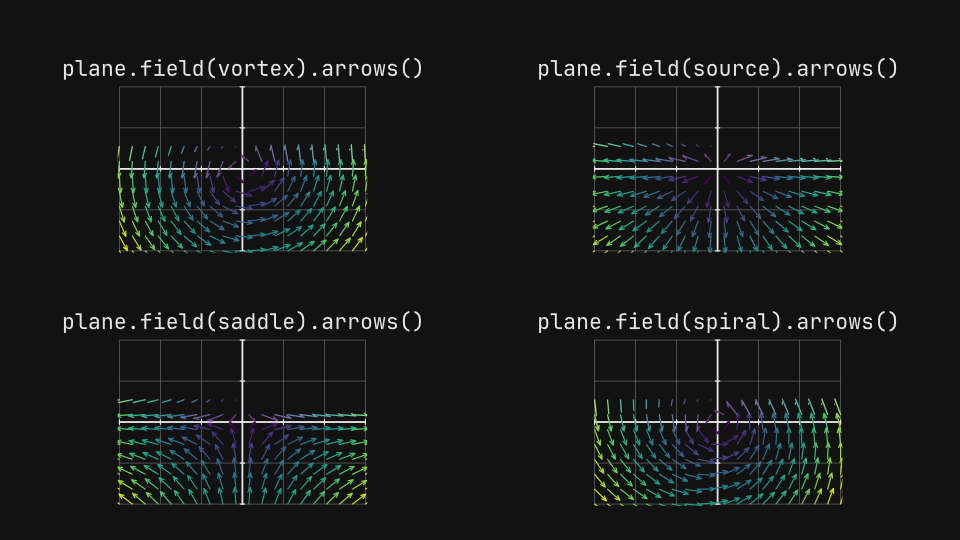
gaanim examples/visualization/vector_fields.pyCode · 142 lines
"""Vector fields: arrows, streamlines, flowing highlights, particles, advection and color maps.

``plane.field(f)`` wraps a function (x, y) -> (u, v) in a ``VectorField``
that draws nothing by itself: arrows, streamlines and particles are views
of it. The first segments show fields and their arrow and streamline
options, the next ones set them in motion, and the last one colors them.
"""

import os

from gaanim import Axis, ColorMap, Scene, Zones

DRAW = 1.2
HOLD = 0.8
FLOW = 3.0
# A gallery draws its planes, then their views, then holds.
STEP = 2 * DRAW + HOLD

scene = Scene()
accent = scene.canvas.color("accent")
danger = scene.canvas.color("danger")
X = Axis.linear(-3, 3).ticks(1)
Y = Axis.linear(-2, 2).ticks(1)


def vortex(x, y):
    return -y, x


def source(x, y):
    return x, y


def saddle(x, y):
    return x, -y


def spiral(x, y):
    return -y - 0.3 * x, x - 0.3 * y


def cells(count, bands=("2fr", "7fr")):
    """A padded 2-column grid of ``count`` cells, each split into a label band and a body."""
    grid = scene.layout.zones(
        Zones.grid(rows=-(-count // 2), columns=2, column_gap="96px", row_gap="48px", padding="page_padding")
    )
    return [cell.split(Zones.rows(list(bands))) for cell in list(grid)[:count]]


def plane_in(body):
    """A plane without numbers, its plot area 3:2 and as large as ``body`` allows."""
    height = min(body.height * 0.92, body.width * 0.92 * 2 / 3)
    plane = scene.viz.cartesian_2d(X, Y, width=height * 1.5, height=height, numbers=False)
    return plane.move_to(*body.center)


def gallery(variants):
    """Draw a plane per (label, build) cell and the view ``build(plane)`` returns on it."""
    planes, views = [], []
    for (top, body), (label, build) in zip(cells(len(variants)), variants):
        scene.text(label, role="code").place(top, anchor="bottom")
        plane = plane_in(body)
        planes.append(plane)
        views.append(build(plane))
    scene.play([plane.animate.create() for plane in planes], duration=DRAW)
    scene.play([view.animate.write() for view in views], duration=DRAW)
    scene.wait(HOLD)


# Arrows sample the field on a regular grid; their color follows the
# magnitude through the viridis color map unless told otherwise.
scene.segment("fields")
gallery([
    ("plane.field(vortex).arrows()", lambda plane: plane.field(vortex).arrows()),
    ("plane.field(source).arrows()", lambda plane: plane.field(source).arrows()),
    ("plane.field(saddle).arrows()", lambda plane: plane.field(saddle).arrows()),
    ("plane.field(spiral).arrows()", lambda plane: plane.field(spiral).arrows()),
])

# resolution= is the number of arrows per axis, max_length= and
# length_scale= size them, width= thickens the shafts and color= replaces
# the color map with one color.
scene.segment("arrows")
gallery([
    ("arrows(resolution=(9, 6))", lambda plane: plane.field(spiral).arrows(resolution=(9, 6))),
    ("arrows(max_length=0.5,\n       width=0.04)", lambda plane: plane.field(spiral).arrows(max_length=0.5, width=0.04)),
    ("arrows(length_scale=0.3,\n       min_length=0.1)", lambda plane: plane.field(spiral).arrows(length_scale=0.3, min_length=0.1)),
    ("arrows(color=accent)", lambda plane: plane.field(spiral).arrows(color=accent)),
])

# Streamlines integrate the field from a grid of seeds, kept apart by
# separation=; direction= follows the field forward, backward or both.
scene.segment("streamlines")
gallery([
    ("streamlines()", lambda plane: plane.field(spiral).streamlines()),
    ("streamlines(seeds=(6, 4),\n            separation=0.2)", lambda plane: plane.field(spiral).streamlines(seeds=(6, 4), separation=0.2)),
    ('streamlines(direction="forward",\n            max_time=1)', lambda plane: plane.field(spiral).streamlines(direction="forward", max_time=1)),
    ("streamlines(width=0.05, opacity=0.6)", lambda plane: plane.field(spiral).streamlines(width=0.05, opacity=0.6)),
])

# flow() runs brighter highlights along the streamlines; particles() seeds
# points that flow() carries along the field, and advect() moves any
# object's center along the path from one seed.
scene.segment("flow")
top, body = scene.layout.zones(Zones.rows(["1fr", "6fr"], padding="page_padding"))
scene.text(
    "scene.play(streams.flow(3, time_width=0.15) + particles.flow()\n"
    "           + [field.advect(dot, (2.5, 0), duration=3)])",
    role="code",
).place(top, anchor="bottom_left")
plane = scene.viz.cartesian_2d(X, Y, width=body.height * 1.5 * 0.92, height=body.height * 0.92, numbers=False)
plane.move_to(*body.center)
field = plane.field(spiral)
streams = field.streamlines(seeds=(14, 9), opacity=0.5)
particles = field.particles(24, radius=0.06, duration=FLOW)
dot = scene.geometry.dot(0.16).fill(accent)
scene.play([plane.animate.create(), streams.animate.write(), particles.animate.fade_in()], duration=DRAW)
scene.play(streams.flow(FLOW, time_width=0.15) + particles.flow() + [field.advect(dot, (2.5, 0), duration=FLOW)])
scene.wait(HOLD)

# colormap= takes a ColorMap or a name (Matplotlib and Scientific Colour
# Maps); color_range= fixes the magnitudes at its two ends.
scene.segment("color_maps")
gallery([
    ('arrows(colormap="batlow")', lambda plane: plane.field(spiral).arrows(colormap="batlow")),
    ('arrows(colormap=\n    ColorMap("viridis").reversed())', lambda plane: plane.field(spiral).arrows(colormap=ColorMap("viridis").reversed())),
    ("arrows(colormap=ColorMap.from_colors(\n    [accent, danger]))", lambda plane: plane.field(spiral).arrows(colormap=ColorMap.from_colors([accent, danger]))),
    ('streamlines(colormap="vik",\n            color_range=(0, 2))', lambda plane: plane.field(spiral).streamlines(colormap="vik", color_range=(0, 2))),
])

if snapshots := os.environ.get("GAANIM_SNAPSHOTS"):
    # Each gallery while its views draw and once drawn, the flow at three
    # moments and the color maps.
    scene.snapshots(
        snapshots,
        [STEP * index + t for index in range(3) for t in (1.8, 2.8)]
        + [STEP * 3 + t for t in (1.0, 2.2, 3.6)]
        + [STEP * 3 + DRAW + FLOW + HOLD + 2.8],
    )
else:
    scene.render()
Readouts
Rolling counters in every format and mode, live readouts of parameters, functions and time, progress rings and countdowns.
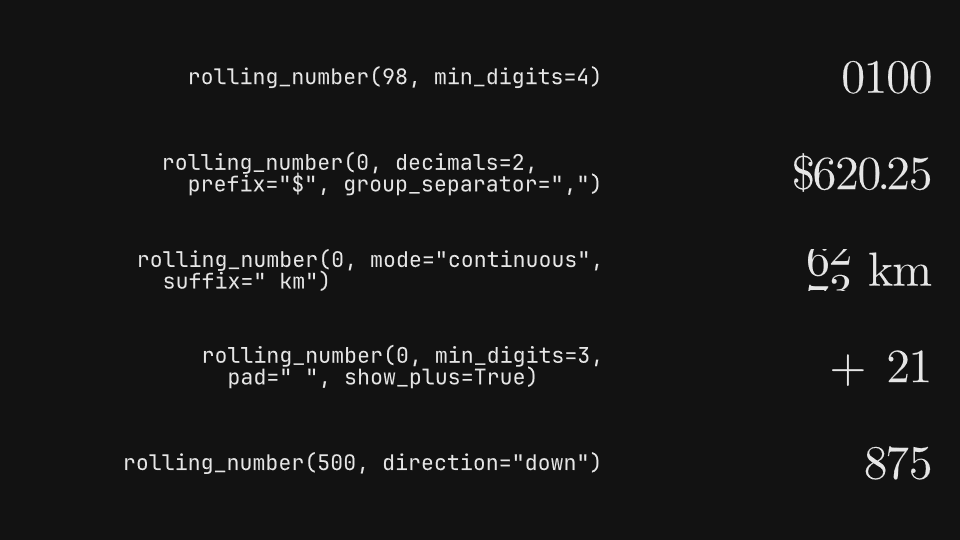
gaanim examples/visualization/readouts.pyCode · 144 lines
"""Readouts: rolling counters, live numeric readouts, progress rings and countdowns.

Rolling numbers turn their digits like an odometer, readouts show a
reactive value with a label and a unit, and progress rings fill with a value
or count down seconds. Each label is the code that builds its variant.
"""

import os

from gaanim import Anchor, Easing, Scene, TextAnchor, Zones

scene = Scene()
viz = scene.viz
accent = scene.canvas.color("accent")
success = scene.canvas.color("success")

COUNT = 3.0
HOLD = 0.6


def table(labels, columns=("2fr", "1fr")):
    """One padded row per label, the code right-aligned on the left; return the cells on the right."""
    grid = list(scene.layout.zones(
        Zones.grid(rows=len(labels), columns=list(columns), column_gap="96px", padding="page_padding")
    ))
    for cell, label in zip(grid[0::2], labels):
        scene.text(label, role="code").place(cell, anchor="right")
    return grid[1::2]


# A rolling number keeps fixed-width digit cells and turns its wheels as
# the value changes: odometer wheels carry in the last unit, continuous
# ones all spin at their own speed. pad=" " reserves blank cells so the
# display keeps its width, and a negative value keeps a static minus sign.
scene.segment("counters")
cells = table([
    "rolling_number(98, min_digits=4)",
    'rolling_number(0, decimals=2,\n  prefix="$", group_separator=",")',
    'rolling_number(0, mode="continuous",\n  suffix=" km")',
    'rolling_number(0, min_digits=3,\n  pad=" ", show_plus=True)',
    'rolling_number(500, direction="down")',
])
counters = [
    viz.rolling_number(98, min_digits=4, font_size=0.8),
    viz.rolling_number(0, decimals=2, prefix="$", group_separator=",", font_size=0.8),
    viz.rolling_number(0, mode="continuous", suffix=" km", font_size=0.8),
    viz.rolling_number(0, min_digits=3, pad=" ", show_plus=True, font_size=0.8),
    viz.rolling_number(500, direction="down", font_size=0.8),
]
# Counters grow to the left, so they are aligned by their right edge.
for counter, cell in zip(counters, cells):
    counter.move_to(*cell.point("right"), anchor=Anchor.RIGHT)
scene.wait(0.3)
scene.play([
    counters[0].count_to(102, duration=COUNT).easing(Easing.LINEAR),
    counters[1].count_to(1240.5, duration=COUNT),
    counters[2].animate.set(125).duration(COUNT).easing(Easing.LINEAR),
    counters[3].count_to(42, duration=COUNT),
    counters[4].count_to(1250, duration=COUNT),
])
scene.wait(HOLD)
scene.play([
    counters[0].count_to(-12, duration=COUNT),
    counters[1].count_to(999.95, duration=COUNT),
    counters[2].count_to(0, duration=COUNT),
    counters[3].count_to(-7, duration=COUNT),
    counters[4].count_to(480, duration=COUNT),
])
scene.wait(HOLD)

# A readout shows a Parameter, a Computed, scene time or a function of
# inputs, with an optional label, "=" and unit. format is a Python format
# specification, and decimal_separator="," swaps the separators.
scene.segment("readouts")
cells = table([
    'readout(speed, label="v", unit="m/s")',
    'readout(lambda v: v * v, inputs=[speed],\n  label="v²", format=".1f")',
    'readout(share, format=".0%")',
    'readout(viz.time, label="t",\n  format=".2f", suffix=" s")',
    'readout(total, format=",.2f",\n  decimal_separator=",")',
    'readout(speed, label="v",\n  color=accent, font_size=0.8)',
])
speed = viz.parameter(0.0)
share = viz.parameter(0.0)
total = viz.parameter(0.0)
readouts = [
    viz.readout(speed, label="v", unit="m/s", font_size=0.6),
    viz.readout(lambda v: v * v, inputs=[speed], label="v²", format=".1f", font_size=0.6),
    viz.readout(share, format=".0%", font_size=0.6),
    viz.readout(viz.time, label="t", format=".2f", suffix=" s", font_size=0.6),
    viz.readout(total, format=",.2f", decimal_separator=",", font_size=0.6),
    viz.readout(speed, label="v", color=accent, font_size=0.8),
]
for readout, cell in zip(readouts, cells):
    x, y = cell.point("left")
    readout.move_to(x, y - 0.18, anchor=TextAnchor.BASELINE_LEFT)
scene.wait(0.3)
scene.play([speed.animate.set(12.5), share.animate.set(0.85), total.animate.set(1234.5)], duration=COUNT)
scene.wait(HOLD)

# A progress ring fills clockwise from 12 o'clock with a value in [0, 1]
# and rolls its percentage in the center; a countdown starts full and
# empties as its seconds run out.
scene.segment("progress")
cells = scene.layout.zones(Zones.grid(rows=2, columns=2, gap="64px", padding="page_padding"))
LABELS = [
    "progress_ring(0)",
    "progress_ring(0,\n  decimals=1,\n  width=0.3)",
    "progress_ring(0,\n  label=False,\n  color=success)",
    "countdown(5)",
]
rings = [
    viz.progress_ring(0, radius=1.3),
    viz.progress_ring(0, radius=1.3, decimals=1, width=0.3),
    viz.progress_ring(0, radius=1.3, label=False, color=success),
    viz.countdown(5, radius=1.3, font_size=0.8),
]
for cell, ring, label in zip(cells, rings, LABELS):
    stage, caption = cell.split(Zones.columns(["1fr", "1fr"], gap="48px"))
    ring.move_to(*stage.center)
    scene.text(label, role="code").place(caption, anchor="left")
scene.wait(0.3)
scene.play([
    rings[0].animate.set(0.75).duration(COUNT),
    rings[1].animate.set(0.333).duration(COUNT),
    rings[2].animate.set(1.0).duration(COUNT),
    rings[3].count_down(),
])
scene.wait(HOLD)

COUNTERS_END = 0.3 + 2 * (COUNT + HOLD)
READOUTS_END = COUNTERS_END + 0.3 + COUNT + HOLD
if snapshots := os.environ.get("GAANIM_SNAPSHOTS"):
    # The counters rising, settled, falling and settled; the readouts midway
    # and done; the rings midway, filled and the countdown at zero.
    scene.snapshots(
        snapshots,
        [0.3 + COUNT / 2, 0.3 + COUNT + 0.2, 0.3 + COUNT + HOLD + COUNT / 2, COUNTERS_END - 0.1]
        + [COUNTERS_END + 0.3 + COUNT / 2, READOUTS_END - 0.1]
        + [READOUTS_END + 0.3 + COUNT / 2, READOUTS_END + 0.3 + COUNT + 0.1, READOUTS_END + 0.3 + 5 + HOLD - 0.1],
    )
else:
    scene.render()